Busby Dashboards can be used to visualise data from other services in your busby system. They require the setting up of a Dashboard Manager service and a corresponding Dashboard UI application. This can either be achieved by polling a report from a service or by listening to status messages from a service.
authenticationService, reportAndAct, bigDataService and scriptStep.
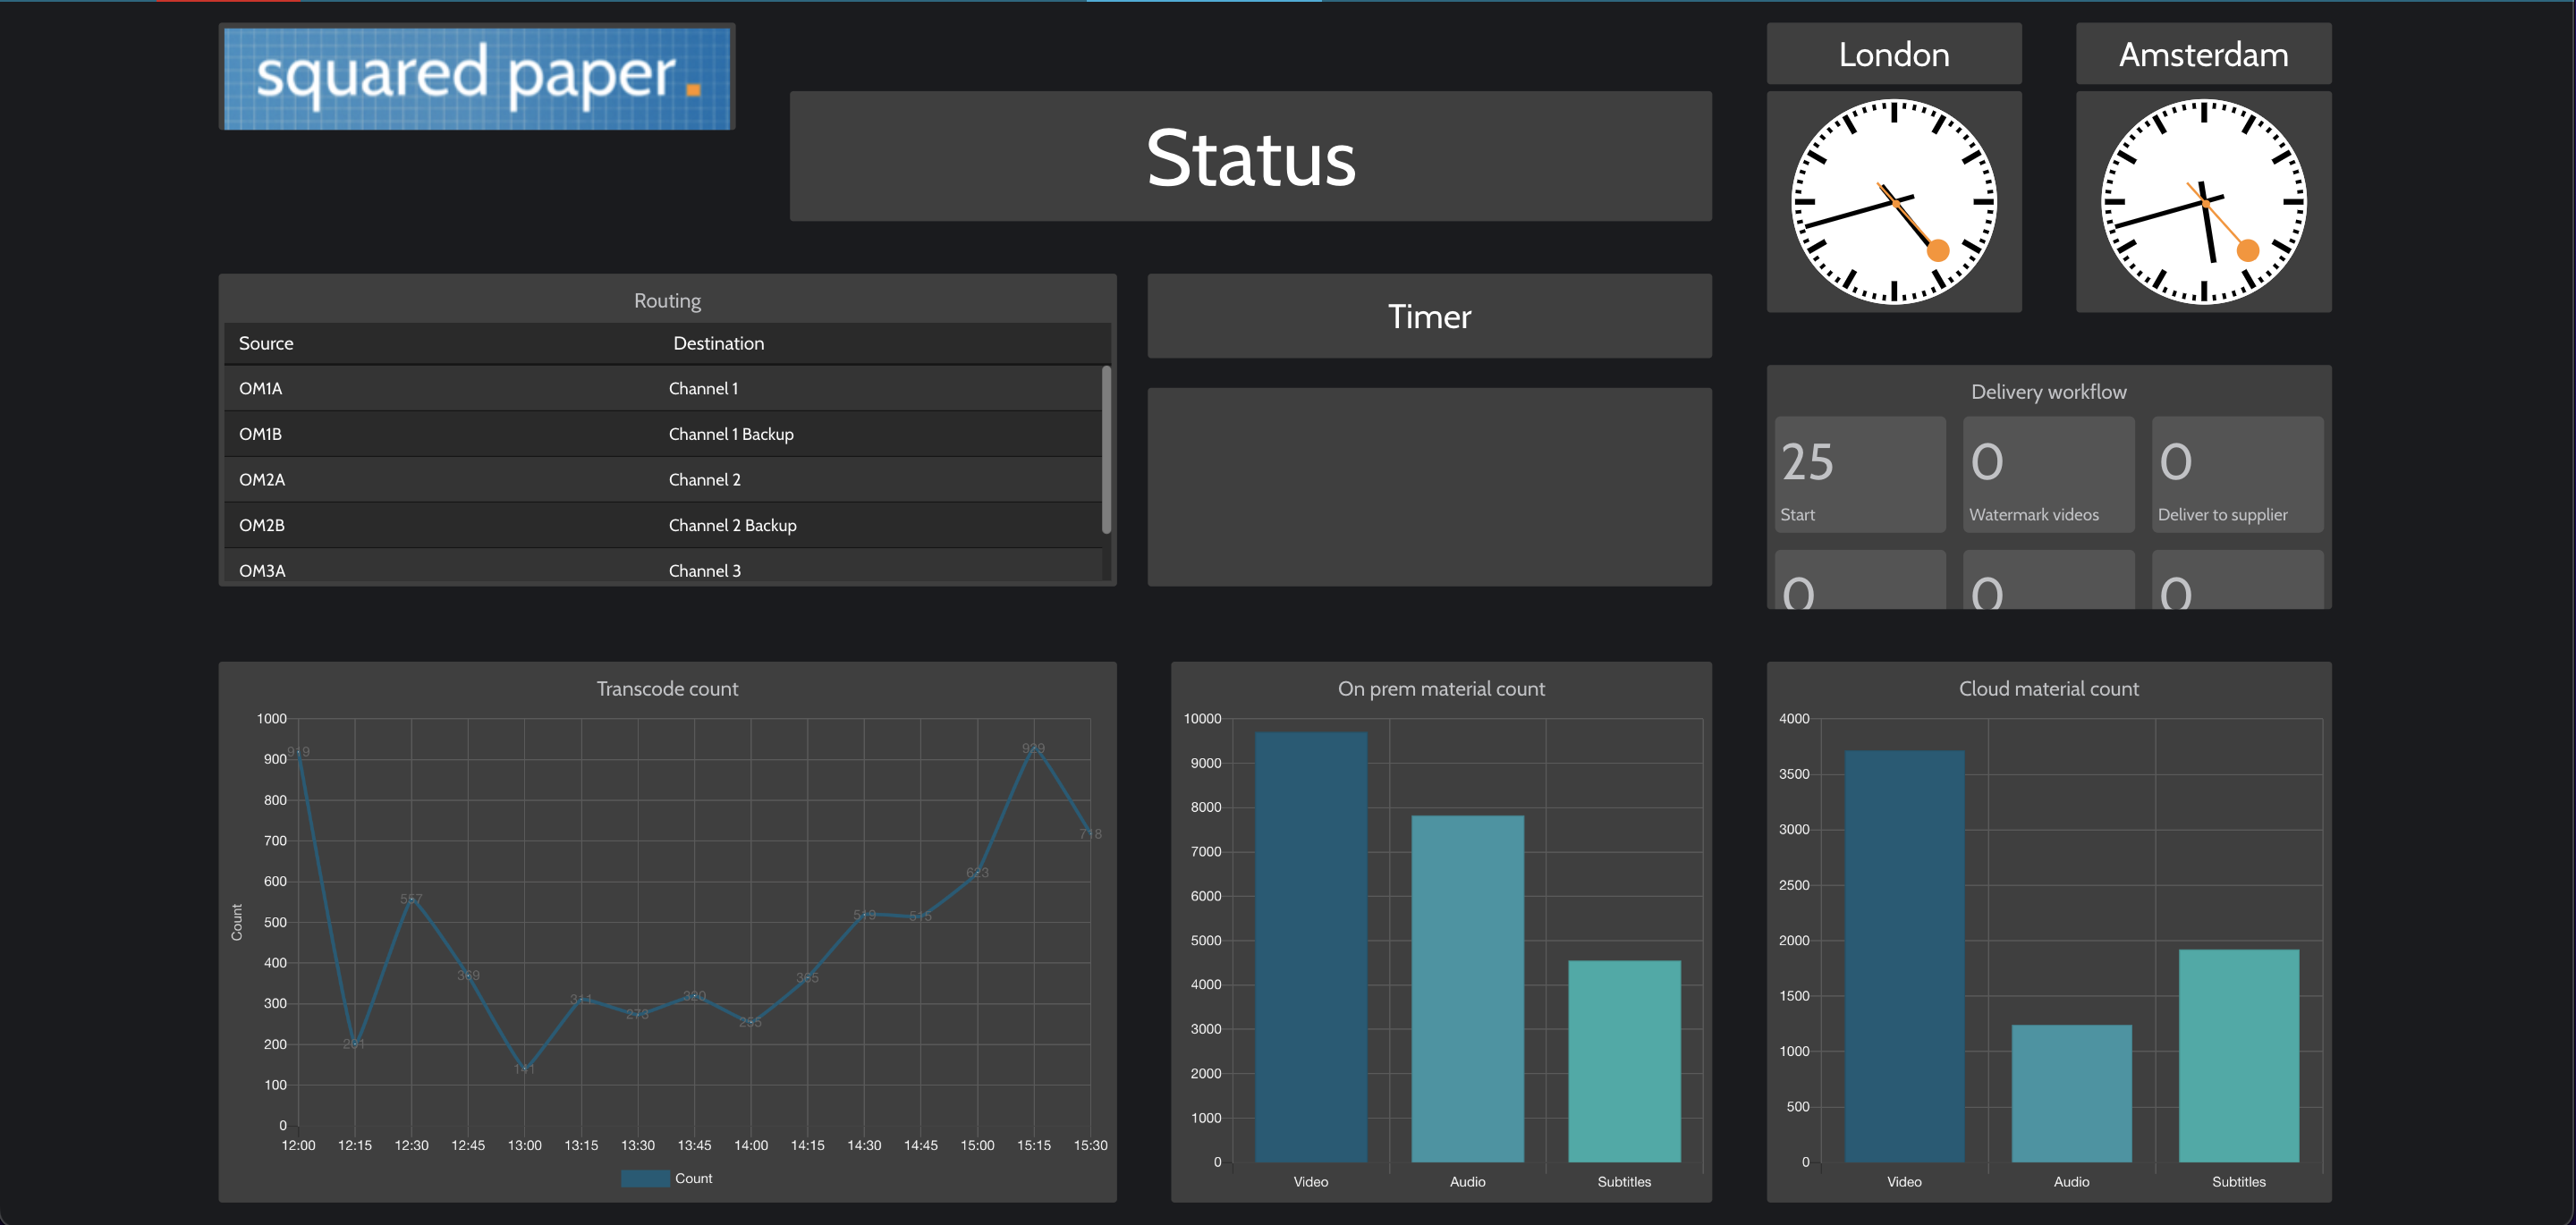
¶ Widgets
Dashboards can contain several graphical elements or widgets. These widgets are rendered in standard HTML5 for modern browser compatibility and can display both static and dynamic content.
Static widgets: label or image.
Dynamic widgets: line graph, bar graph, table, dynamic labels.
More details of these widgets can be found below.
¶ Static widgets
Displays a static text string. The text size and alignment can be modified.

Displays a static image. The image source be a URL or local file path.

¶ Dynamic widgets
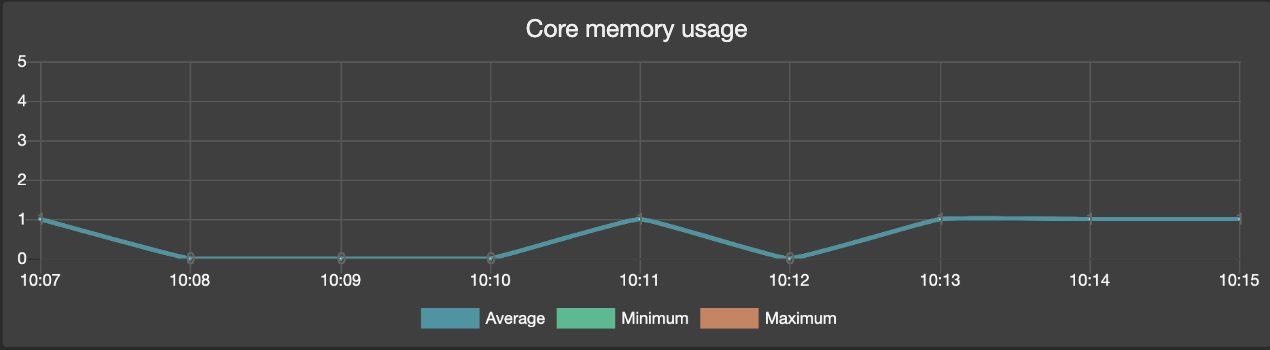
Displays time based data. The displayed data is mapped from report data.
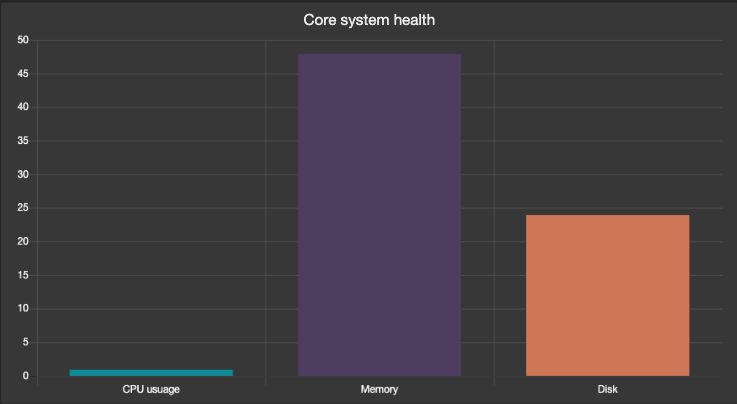
Displays instantaneous data which is mapped from report.
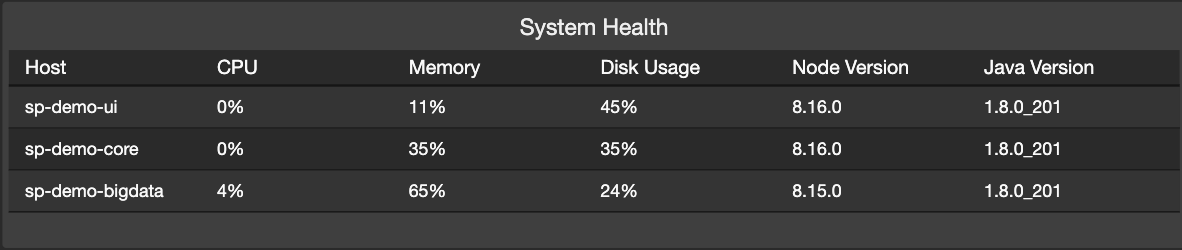
Displays tabular data which is mapped from report.
Displays a text string which is data sourced from a status message.